
 The impact of climate change on our health
 The impact of climate change on our health
No less than 85% of Quebecers are concerned about climate change, according to a Léger poll released at the end of 2020.
Climate change has an impact on health and can hamper provincial strategies to improve well-being:
- With climate events such as extreme heat comes an increase in emergency hospitalizations, transport by ambulance and even deaths;
- With the geographic expansion of ticks, which can survive and spread further within this climatic context, the number of Lyme cases has been increasing over the past 10 years;
- With warmer and longer summers, pollen allergies are worsening.
Mental health is also affected. We speak of ecoanxiety, a feeling of anxiety or concern experienced in the face of upheavals caused by climate change (source: Office de la langue française, 2019). While the phenomenon is relatively new, Montreal psychologist Joe Flanders is seeing an increase in the number of patients concerned about the environment.
According to Ouranos¹, the effects of heat could cost society $33 billion in health costs by 2065, and the effects of certain diseases (Lyme and West Nile virus) $744 million. Beyond these costs, the Institut national de la santé publique du Québec (INSPQ) estimates that air pollution will be responsible for 2,000 premature deaths every year. Over the next 50 years, 20,000 deaths will be caused by rising temperatures.
These findings provide food for thought about possible solutions. The global community of decision-makers is asking: how will the climate evolve over the coming decades, and what can we do to reduce the impact of climate change?
![]()
The importance of data in understanding and reducing the impact of climate change
ClimateData.ca, funded in part by the Government of Canada and led by CRIM, was developed collaboratively by leading Canadian climate organizations.
The aim is to support decision-makers across Canada in a wide range of sectors by providing historical and future climate data in user-friendly formats. Users can visualize, understand and analyze the most up-to-date climate information produced by the latest scientific advances. This climate information is essential both for the analysis of expected climate risks and for the evaluation of the various adaptation measures planned to deal with them.
“This tool is very important, as there is still a disparity between what scientists know and what the general public knows about this subject. This tool becomes a resource for those who might have doubts about the importance of climate change.”
– Catherine McKenna, Federal Minister of the Environment and Climate Change in 2019, now Minister of Infrastructure and Communities.
Here are two examples of how the portal can help health professionals better plan, among other things, decisions related to development or resource allocation.
Example 1: Heat waves
Thanks to the Climatedata.ca portal, public health authorities can find out how many heat waves are expected in the future.
Let’s take the Côte-des-Neiges-Notre-Dame-de-Grâce borough in Montreal: before 2050, the number of days with a temperature above 32 degrees Celsius increases similarly according to the three greenhouse gas emission scenarios (red, green, blue curves). However, from 2050 onwards, we can see that the number of days with a temperature above 32 degrees Celsius begins to increase much more rapidly, particularly under the highest emissions scenario (red curve).
Urban planners can use these projections to help make decisions about future projects.
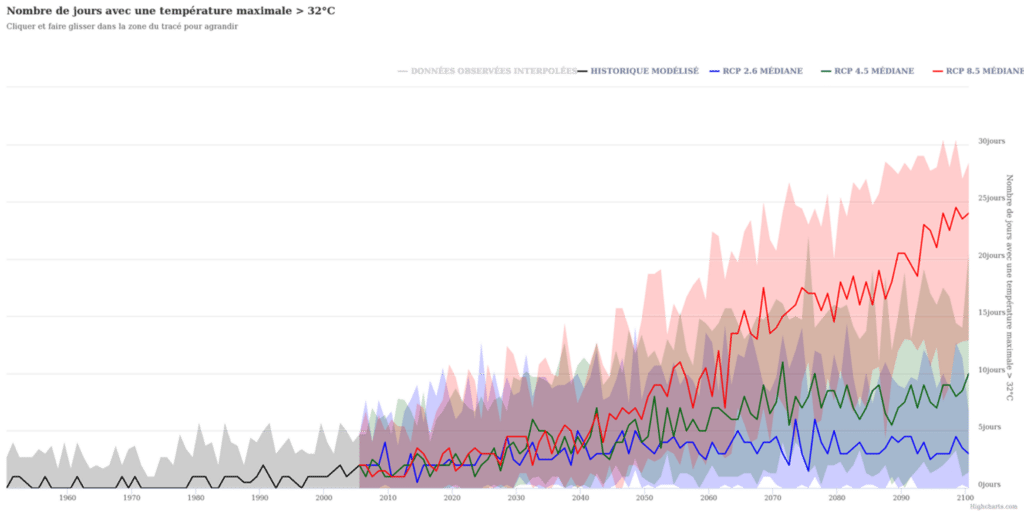
Figure 1: Number of days with temperatures above 32 degrees Celsius according to greenhouse gas emission scenarios for a 1960-2070 horizon
With this information, local authorities can better anticipate risks, such as increases in hospitalizations, as well as update response plans for extreme heat waves. Municipalities can also implement new measures, such as issuing heat alerts or setting up cool areas. Municipalities can also introduce new measures, such as issuing heat alerts or setting up cool islands.
Example 2: Ticks and Lyme disease
The same reflexes can be developed to reduce cases of Lyme disease. A tick can be active at temperatures as low as 0 degrees Celsius. With global warming comes an increase in the number of annual degree-days above zero, with a minimum of 2,800 degree-days above freezing required for tick survival². The range of tick activity in Ontario and Quebec has already increased considerably in recent years.

ClimateData.ca uses the cumulative degree-days tallied during the summer season to create maps allowing for quick information visualization.
This information could be used to assess which areas are likely to be, or may become, suitable for tick survival in the future. This is already helping to target areas where local health authorities are keeping a watchful eye.
Figure 2 presents this climate indicator as estimated using 24 climate simulations from the BCCAQv2 database for 2041-2070. The user can identify regions of Canada that will have a high number of annual degree-days above 0 degrees Celsius (dark green) and therefore, regions where the threat of Lyme disease is likely to increase or even appear.
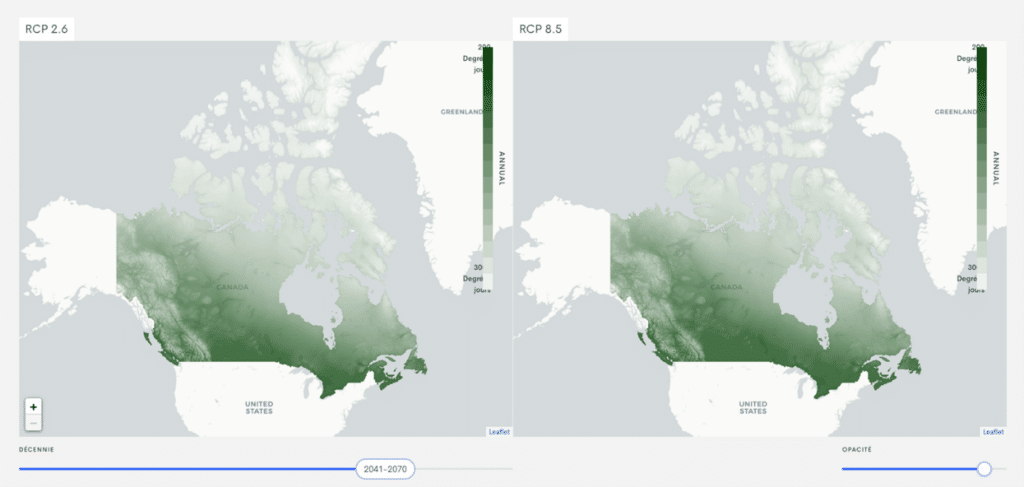
Figure 2: Map of annual 0°C-base degree-days under two greenhouse gas emission scenarios (RCP2.6 and 8.5) for the 2041-2070 horizon
As with heat waves, ClimData.ca can be used to support local intervention efforts in the future. For example, national park networks could set up a system of preventive alerts to the population when new areas become conducive to the presence of ticks.
The benefits of ClimateData.ca
In short, ClimateData.ca provides decision-makers with historical and projected data that, when combined with a range of other factors (e.g. environmental, socio-economic), can lead to positive impact projects.
Let’s imagine that the portal informs urban planners of a sharp increase in heatwaves over the next 50 years. To avoid finding themselves in a problematic situation, they could already :
- Implement urban greening projects. They could also draw up a list of species to be planted according to future temperatures and precipitation, because it’s a well-known fact that planting trees in parking lots acts against heat islands, since trees are real natural air-conditioning systems. During a heatwave, the difference in temperature between a paved area and one shaded by nature can be as much as 12°C³.
- Develop a telephone alert system to reach vulnerable people during periods of heatwave or smog, and inform them of the right behaviors to adopt. A pilot project has already been carried out in the Longueuil agglomeration. The benefits are clear: a 50% reduction in medical services for those who receive the alert, and estimated cost savings ranging from $96,972 to $2,800,000 over 10 years.

ClimateData.ca is a user-friendly tool that offers a glimpse into the future, generating climate projections up to year 2100.
By anticipating the future impacts of climate change more accurately, healthcare professionals and other stakeholders will be able to make the best decisions to reduce risks for the population.