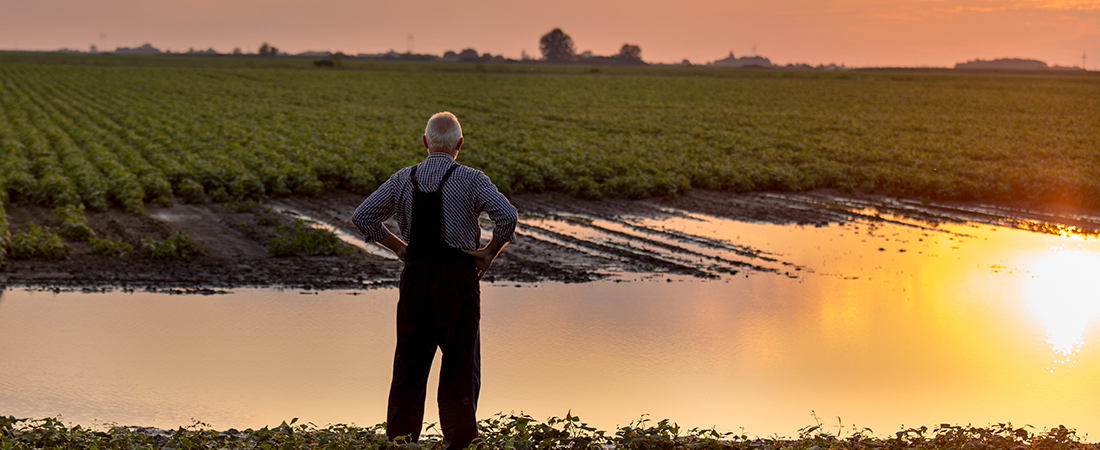
 Climate change and its impact on agriculture
 Climate change and its impact on agriculture
In a survey of the Canadian agricultural sector, 84% of respondents said that climate variability has had an impact on their business. Among the climatic factors affecting farming activities, extreme and unpredictable weather is the most cited.
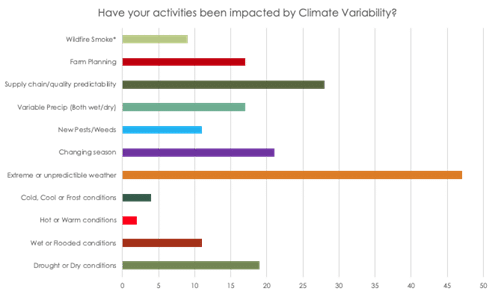
Source: Ag Working Group – Outreach Survey Results
There are many climatic hazards that have an impact on the agricultural sector, including :
- Droughts, and the resulting lack of water supply, can wreak havoc on agriculture, particularly in terms of production, crop yields and harvests. Ten years ago, they caused a drop of almost $6 billion in Canadian GDP [1].
- Early or late rains can make the ground too wet to support farm machinery, and hamper important sowing or harvesting phases, as well as the ripening of many crops [2].
![]()
The importance of data in understanding and reducing the impact of climate change
Data portals such as ClimateData.ca provide information on the evolution of important climatic indices. The main reasons why farmers consult climate data sites are :
- Plan crop and site selection and investments according to changes in growing seasons
- Deploy beneficial management practices (BMPs) to reduce environmental risks, i.e. spraying, insect emergence, water management, economic impact analysis.
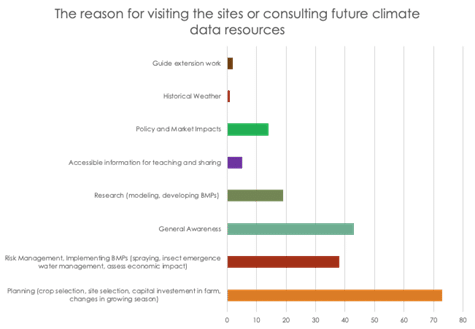
Source: Ag Working Group – Outreach Survey Results
Climatedata.ca provides agricultural professionals with indicators to help them assess the criticality of future situations and make the best decisions. In particular, it makes available minimum and maximum temperatures, precipitation amounts and any climate indicator based on one of these three variables. For example, the portal is useful for assessing changes in humidity levels, the maximum amount of precipitation per day and rainy days exceeding certain fixed thresholds (1 mm, 10 mm, and 20 mm).
Example 1: Drought
Drought is a major issue for farmers. Some regions of Canada are more affected by prolonged periods of drought. These extreme events lead to significant crop losses and disrupt the sustainability of farming operations [3].
Donneesclimatiques.ca uses the standardized precipitation evapotranspiration index, SPEI [4], to assess the risk of future droughts. According to Figure 1, the 2041-70 horizon shows negative values (coded in brown) and therefore a water deficit. An increase in drought is expected throughout the southern part of the country, particularly in the Prairies.
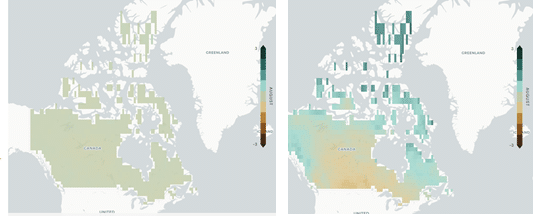
Figure 1: Spatial diagram of future SPEI for an agricultural year (September to August), RCP8.5, median of 29 climate models. Left 1971-2000 horizon; right 2041-70 horizon.
Faced with a future increase in the duration and number of droughts, farmers will be called upon to adopt adaptation strategies, including better monitoring using the SPEI (figure 1).
Example 2: The growing season
Factors associated with climate change that affect forage crops include higher temperatures, rising CO2, reduced water availability and extreme weather events.
Another factor that determines the shape of agriculture in a given region is the growing season (Bradshaw et al., 2004). The growing season is the length of time plants have to grow in a given year [5]. This increased sharply (by around two days per decade) from 1950 to 2010, and is likely to continue to rise steadily with climate change (see figure 2).
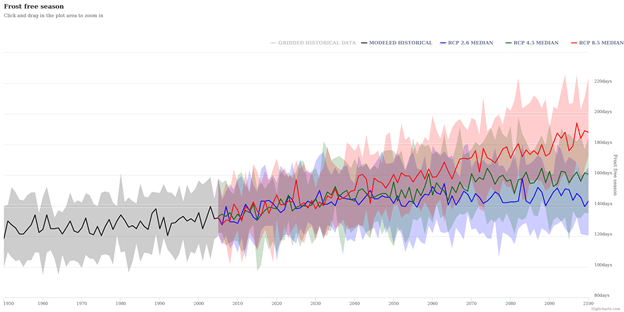
Figure 2: Evolution of growing season length in Killarney, Manitoba.
The longer the growing season, the greater the crop yield potential. However, if there is a drop in precipitation, this can cancel out the potential of a longer growing season. Even if there is an increase in precipitation during the growing season, higher temperatures can result in significant evapotranspiration [6], leading to drought conditions.
As with droughts, it would be useful for farmers to keep an eye on future growing seasons with the help of Climatedata.ca.
The benefits of ClimateData.ca
Farmers have to adapt all the time [7].
With the climate projections available on ClimateData.ca, farmers and other agricultural decision-makers will be better equipped to define adaptation strategies.
Here are some examples of strategies:
- Conventional plant breeding and biotechnology offer new botanical varieties that are more tolerant of drought or saline environments. In the same vein, growers are developing new seed varieties that produce high yields with low inputs (fertilizers, pesticides).
- Diversification of forage crops (alfalfa, timothy) ensures year-round plant survival, even in cold, dry weather.

- Farmers are also opting for a diversity of species rather than concentrating on monocultures, all to ensure better survival. Not all species are affected in the same way by drought or pests.
- Finally, they may decide to increase their forage stock in good years to compensate for shortages in bad years.
In short, Climatedata.ca is an easy-to-use, user-friendly tool that offers a glimpse into the future, generating climate projections up to the year 2100.
By anticipating the future impacts of climate change more accurately, farmers will be able to make the best decisions to reduce the risks to their crops and land.
[1] https://bit.ly/3gSIZFq
[2] https://atlasclimatique.ca/agriculture
[3] https://www.noscommunes.ca/Content/Committee/421/AGRI/Reports/RP9814809/agrirp11/agrirp11-f.pdf
[4] The SPEI indicates the amount of moisture by combining projected changes in temperature and evapotranspiration.
[5] https://www.rncan.gc.ca/changements-climatiques/impacts-adaptation/changements-climatiques/indicateurs-des-changements-fore/saison-croissance/18471
[6] Soil water transfers to the atmosphere.
[7] https://www.noscommunes.ca/Content/Committee/421/AGRI/Reports/RP9814809/agrirp11/agrirp11-f.pdf